Optimize Technology Investments
Modern digital organizations rely on technology to deliver value to their customers. Technologies that enterprises consume include cloud platforms, CRM, ERP, observability, application integration mechanisms, etc. As these assets require significant financial spending, it is paramount for any company to manage the technology portfolio and make optimal decisions about monetary investments and reinvestments. Subsequently, total cost of ownership optimization allows delivering solutions to end users faster, with higher quality, and via optimized margins.
So, how can an organization understand where they have invested the money and the ways to optimize this strategy?
Step #1: Capture Technology Portfolio Information
Before conducting any analysis, we need to collect a complete list of the technologies that the organization consumes. For this exercise, as we look at optimizing the financial spend over the toolset, we can focus on the subset of technology that has cost associated with it.
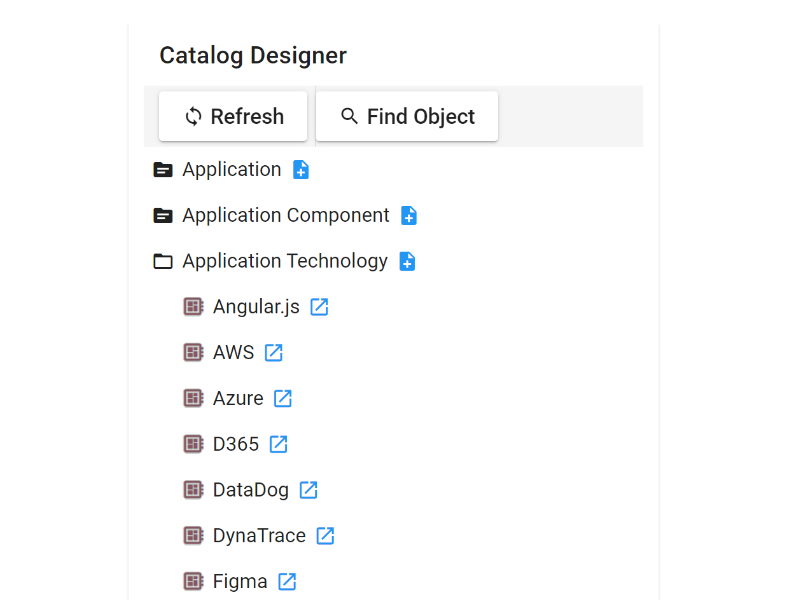
In Archipeg, we will use the object catalog designer to capture all technologies used today by the imaginary company. We've created 26 objects (Application Technologies) under a project configured to use the Archipeg EA v1.0 metamodel. This amount of data should be sufficient for this use case demonstration.

If you prefer to use another metamodel, please create the objects under the type supported by the metamodel of your choice. Since this use case is typical, every metamodel we know supports a way to capture technologies and tools.
Another recommended metamodel for this exercise is Application Portfolio Management, where you can capture the objects under the Component Technology type.
Step #2: Enrich Data for Spend Optimization Analysis
Now that we have the raw data, it's time to think about the spend optimization analysis. We will need to define an approach to enriching the data appropriately. Let's visit the data analyzer and see how it can help.
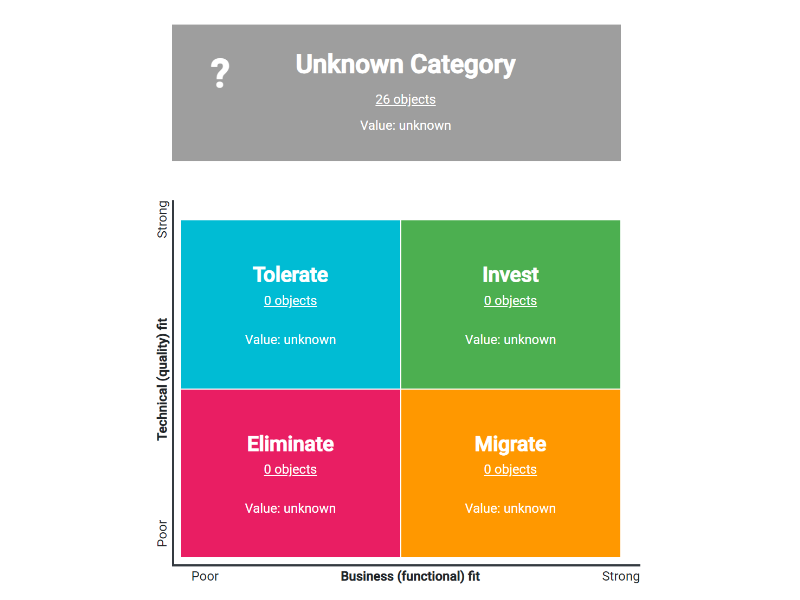
We have filtered the object types to capture Application Technology assets only. The resulting view tells us what to do next.

After looking at the chart, we quickly conclude that we must assign assessments to objects, including Gartner's TIME model-based categorization and financial values. This enrichment will populate the graph with meaningful information for analysis. We can accomplish this step by diving into the Unknown Category on the screen and performing the necessary action for each object underneath.
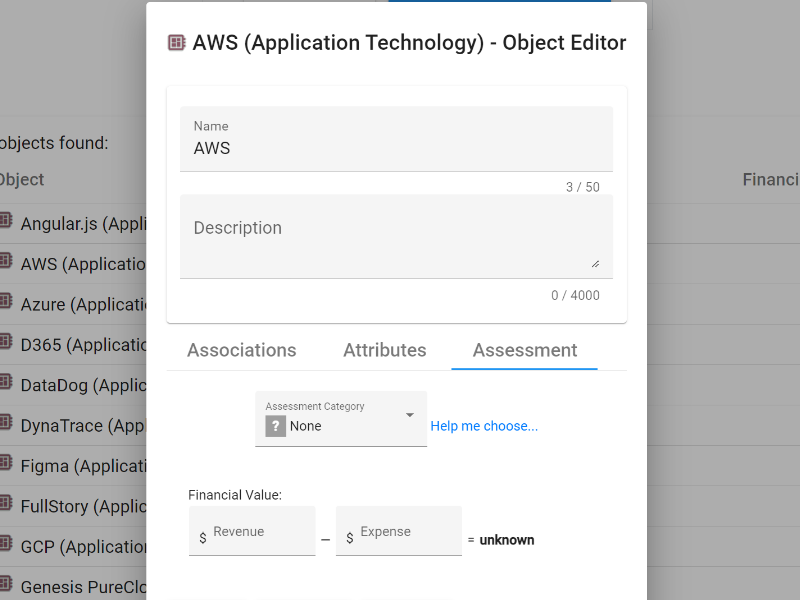
You will find the assessment fields mentioned above by opening an object in the editor dialog and switching to the Assessment tab afterward.

Step #3: Analyze Technology Investments after Enriching Data
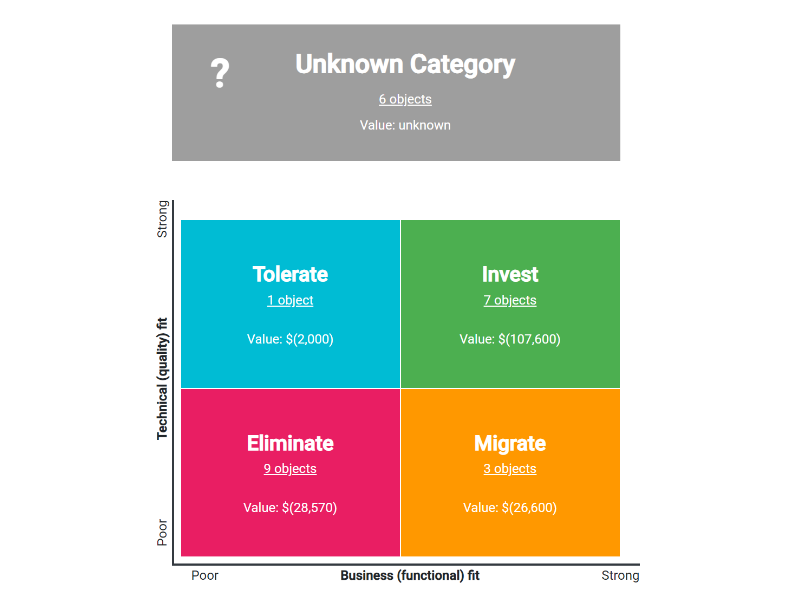
We've gone ahead and populated the assessment information for the relevant objects. Now, objects are spread across categories, and we can also see their financial value for the organization. The total spend is displayed on top of the page and is around $165,000 annually (it's excluded from the below picture).

What does this chart tell us about our technology investments?
- The overall picture looks reasonably healthy. We are investing most of our finances into the technologies that best fit the purpose (Invest category). The only caveat is that it is too expensive. For comparison, we spend about $107,000 for 7 assets while the 9 elimination candidates cost $28,000 (Eliminate category). We can dive into each category to understand what is happening, but we will leave that action outside this use-case.
- We see cost-saving opportunities totaling about $55,000 when summing up the Eliminate and Migrate categories. Among the two, we recommend focusing on the latter since the average cost per asset seems much higher than another bucket.
- On the positive side, we are using a pragmatic investment approach on the newcomers into the technology portfolio as the Tolerate category has one item with a lower financial value at $2,000.
Conclusion
The readout of the analysis chart above is a rational start for the technology portfolio optimization. Without a holistic understanding of the current state, it is not advisable to invest in technologies that can cause significant spending, primarily if it does not deliver on the company's technology strategy and objectives. Therefore, analyze your technology portfolio beforehand and make informed decisions for future investments or reinvestments.
Lastly, as you adjust your technology investment strategy, remember to re-assess the landscape to validate the adequacy of the course of action and pivot as necessary to optimize the benefits and maximize the ROI (Return on Investment).
See Also
- Object Catalog Designer.
- Archipeg EA Framework v1.0 Metamodel.
- Metamodels Overview.
- Application Portfolio Management v1.0 Metamodel.
- Data Analyzer.